As a solutions architect managing a VCF 9 Operations instance, one of the first things I tune after initial deployment is the capacity engine. Out of the box, VCF Operations uses an exponential decay model that heavily weights the most recent data points. That is great for catching sudden spikes, but it can misrepresent your true capacity posture if your environment has cyclical workloads — think month-end batch jobs, quarterly reporting bursts, or seasonal traffic patterns.
If your planning cycles are based on 90 days of usage, you need to make sure the capacity engine’s projections actually reflect that window. In this post I will walk through the policy settings that influence how VCF Operations calculates capacity, and how to configure them so 90 days of historical utilization are meaningfully represented in the results.
Note on naming: VCF Operations 9 is the successor to VMware Aria Operations (formerly vRealize Operations). If you are upgrading from Aria Operations, the same policy concepts apply but some UI labels may differ.
Why 90 Days Matters
Most enterprise procurement and capacity planning processes operate on a quarterly cadence. When leadership asks “do we need to buy more hosts next quarter?”, the answer needs to be rooted in at least 90 days of observed demand — not just the last week of usage.
By default, the VCF Operations capacity engine:
- Uses an exponential decay window for historical data, which means it considers all available history but gives significantly more weight to recent data points.
- Projects 1 year into the future for trend analysis.
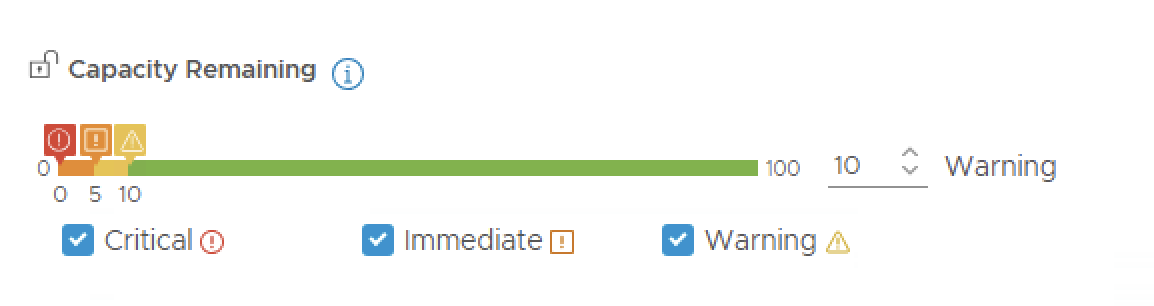
- Calculates Capacity Remaining based on the projected peak usage over the next 3 days.
- Determines Recommended Size by looking at the maximum projected utilization from now until 30 days past the warning threshold.
The problem? If you had a one-time spike last Tuesday, the decay model may over-represent that event. Conversely, if you had a massive batch processing window 60 days ago that will repeat, the decay model may under-represent it. We need to tune the policy so the engine balances both recent and historical data appropriately.
Step 1 — Clone Your Base Policy
Never modify the default vSphere Solution policy directly. Always clone it first so your customizations survive product upgrades.
- Navigate to Infrastructure Operations > Configuration > Policies > Policy Definition.
- Click ADD to create a new policy.
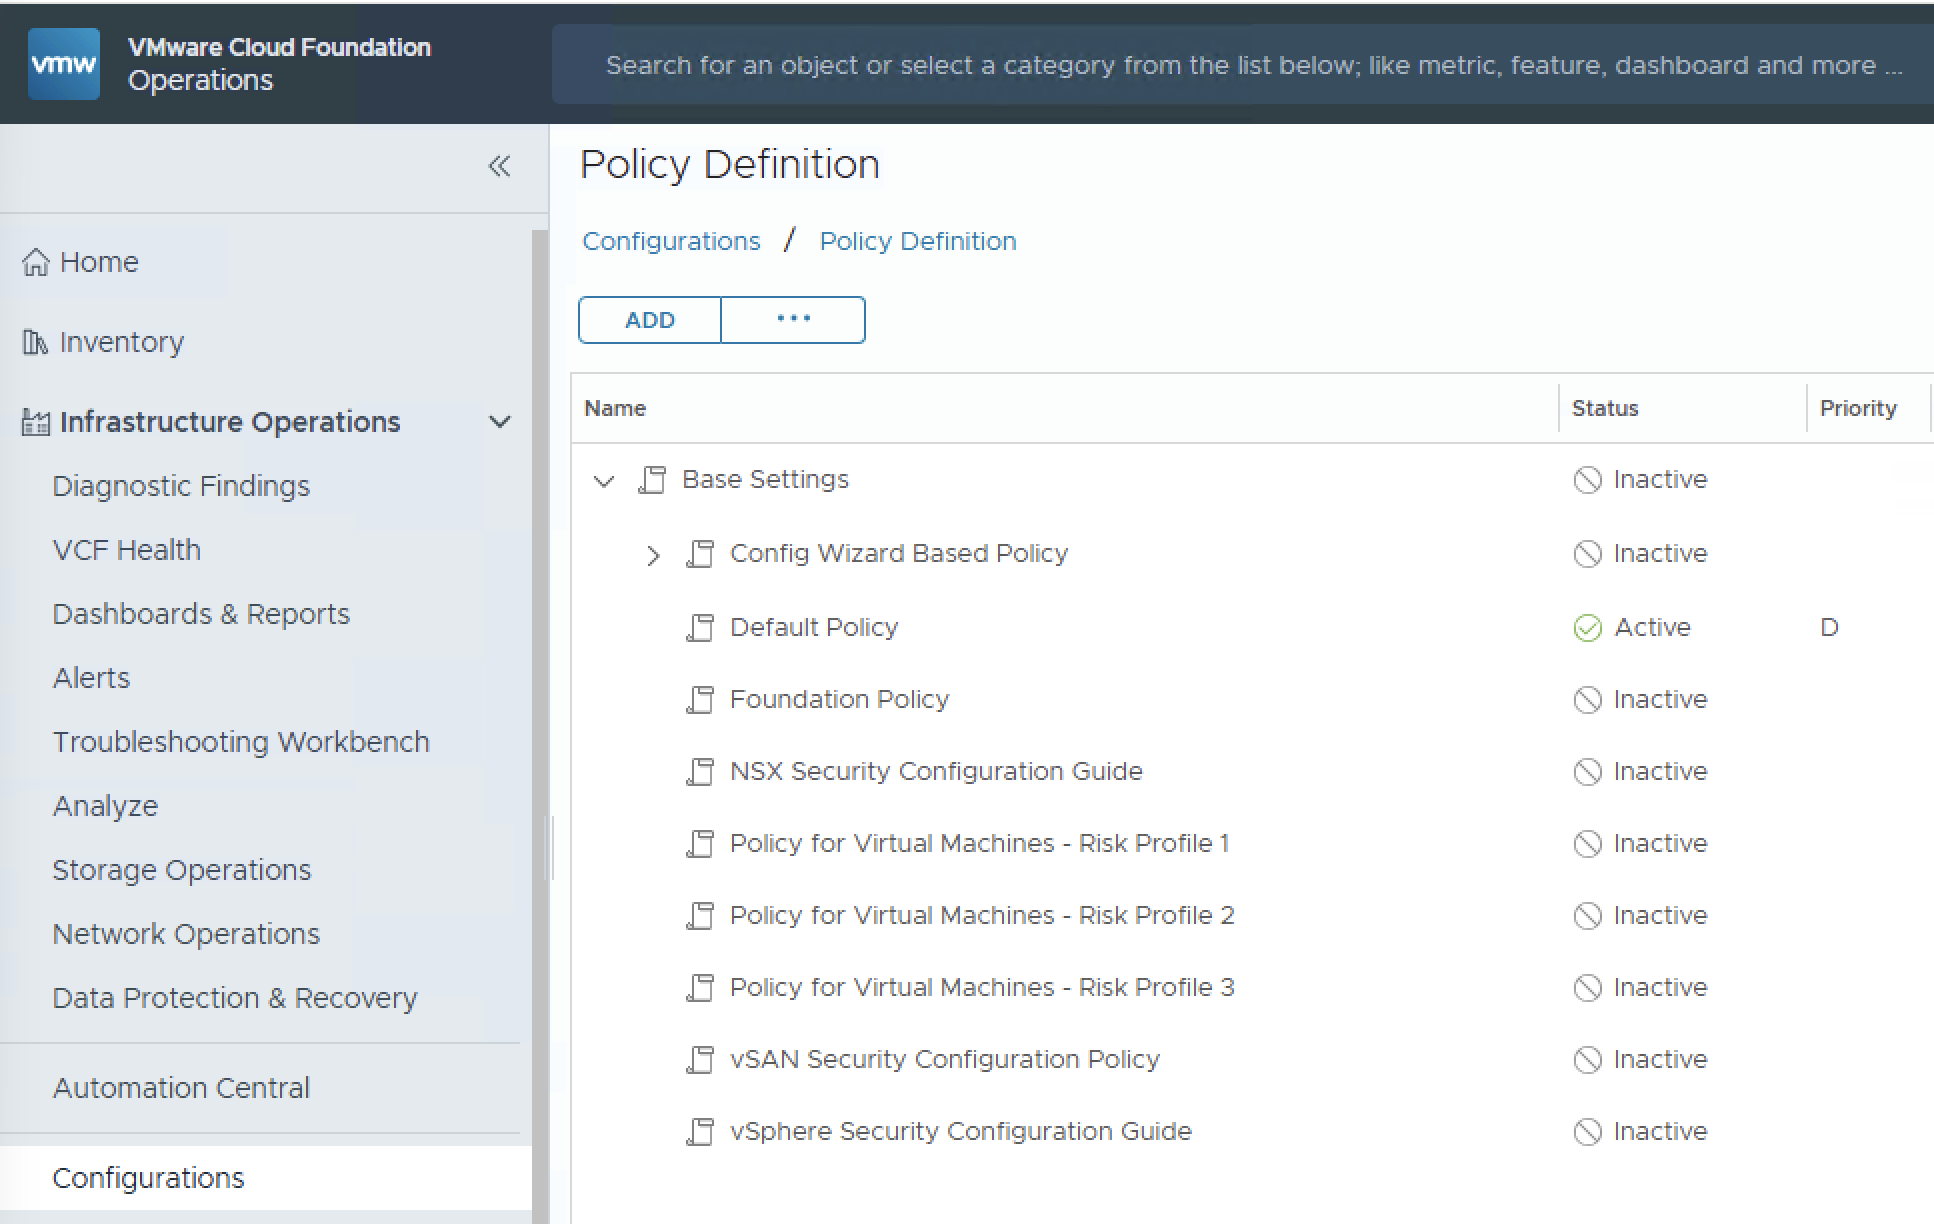
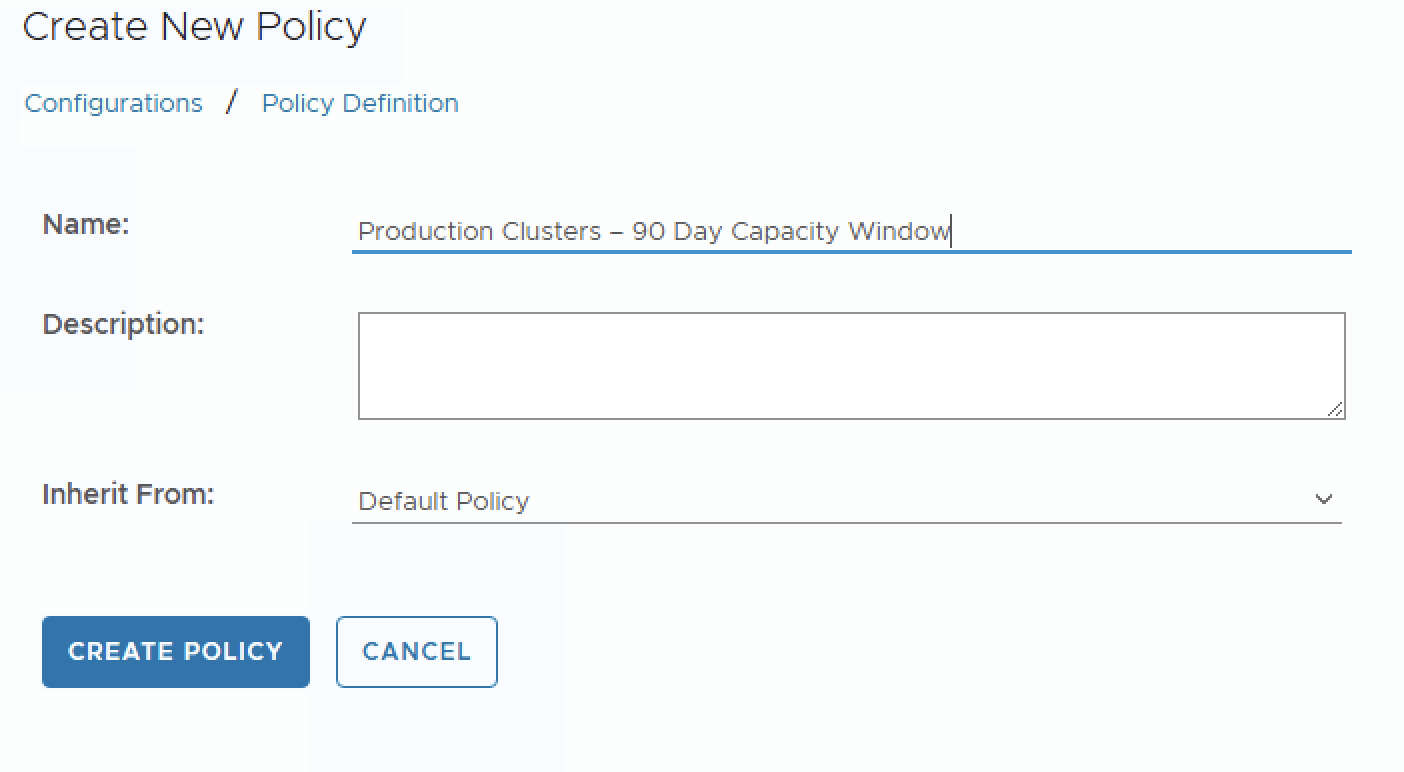
- Select vSphere Solution’s Default Policy (VCF Operations) as the base policy to inherit from.
- Name it something descriptive, e.g.,
Production Clusters – 90 Day Capacity Window. - Click CREATE POLICY.
Tip: Create separate policies for production and non-production workloads. Production should use conservative settings while dev/test can safely use aggressive settings.
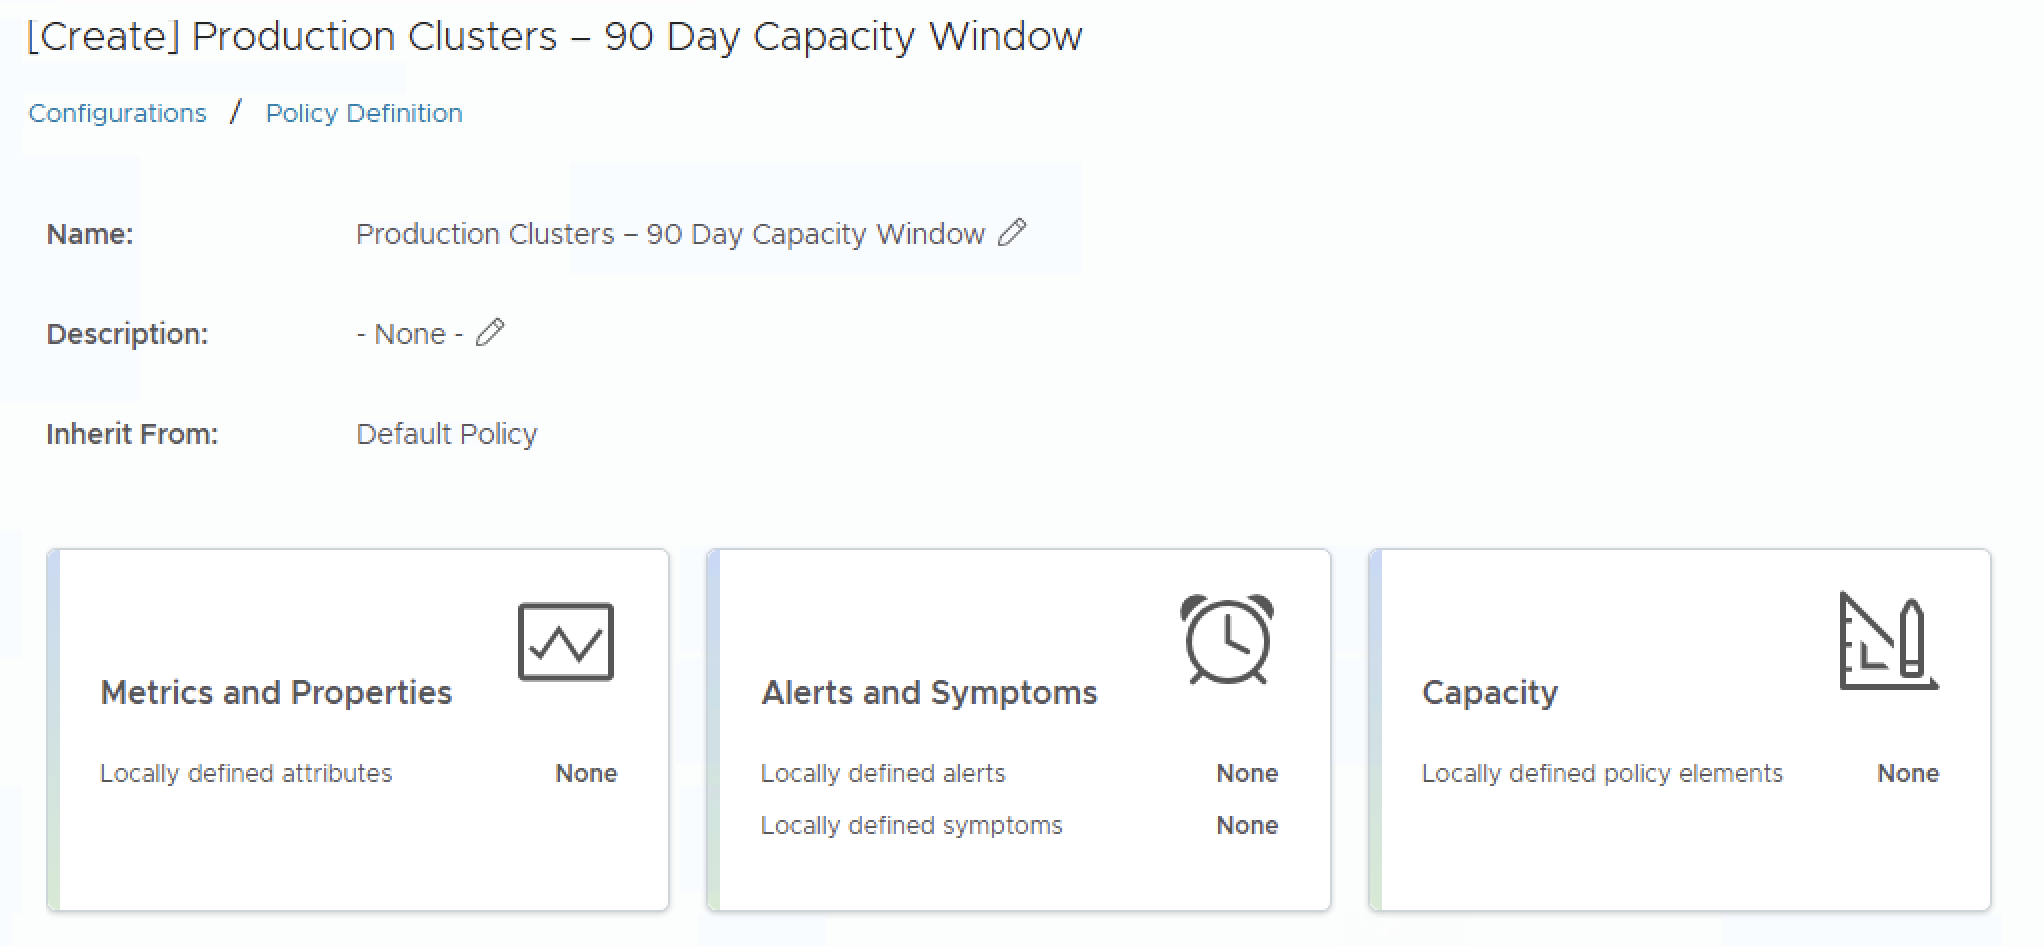
Step 2 — Configure the Capacity Settings
Once inside the policy, navigate to the Capacity settings section. This is where we align the engine with our 90-day planning horizon.
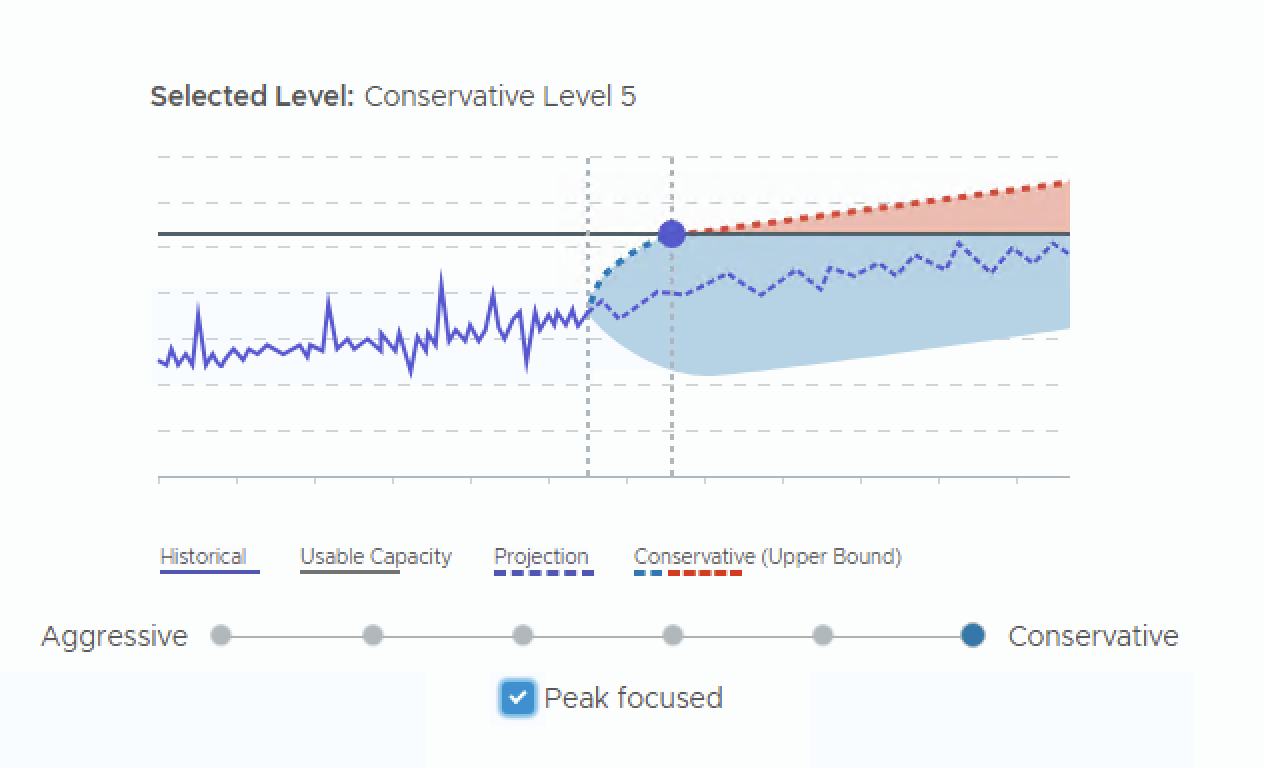
Risk Level: Conservative vs. Aggressive
This setting directly affects how the engine interprets historical data:
- Conservative — Uses the upper bound of the projected utilization range. This means the engine will factor in higher peaks from your 90-day history and project them forward. Use this for production.
- Aggressive — Uses the mean of the upper and lower bound projections. This smooths out peaks but can underestimate future demand. Use this for dev/test environments where higher utilization is acceptable.
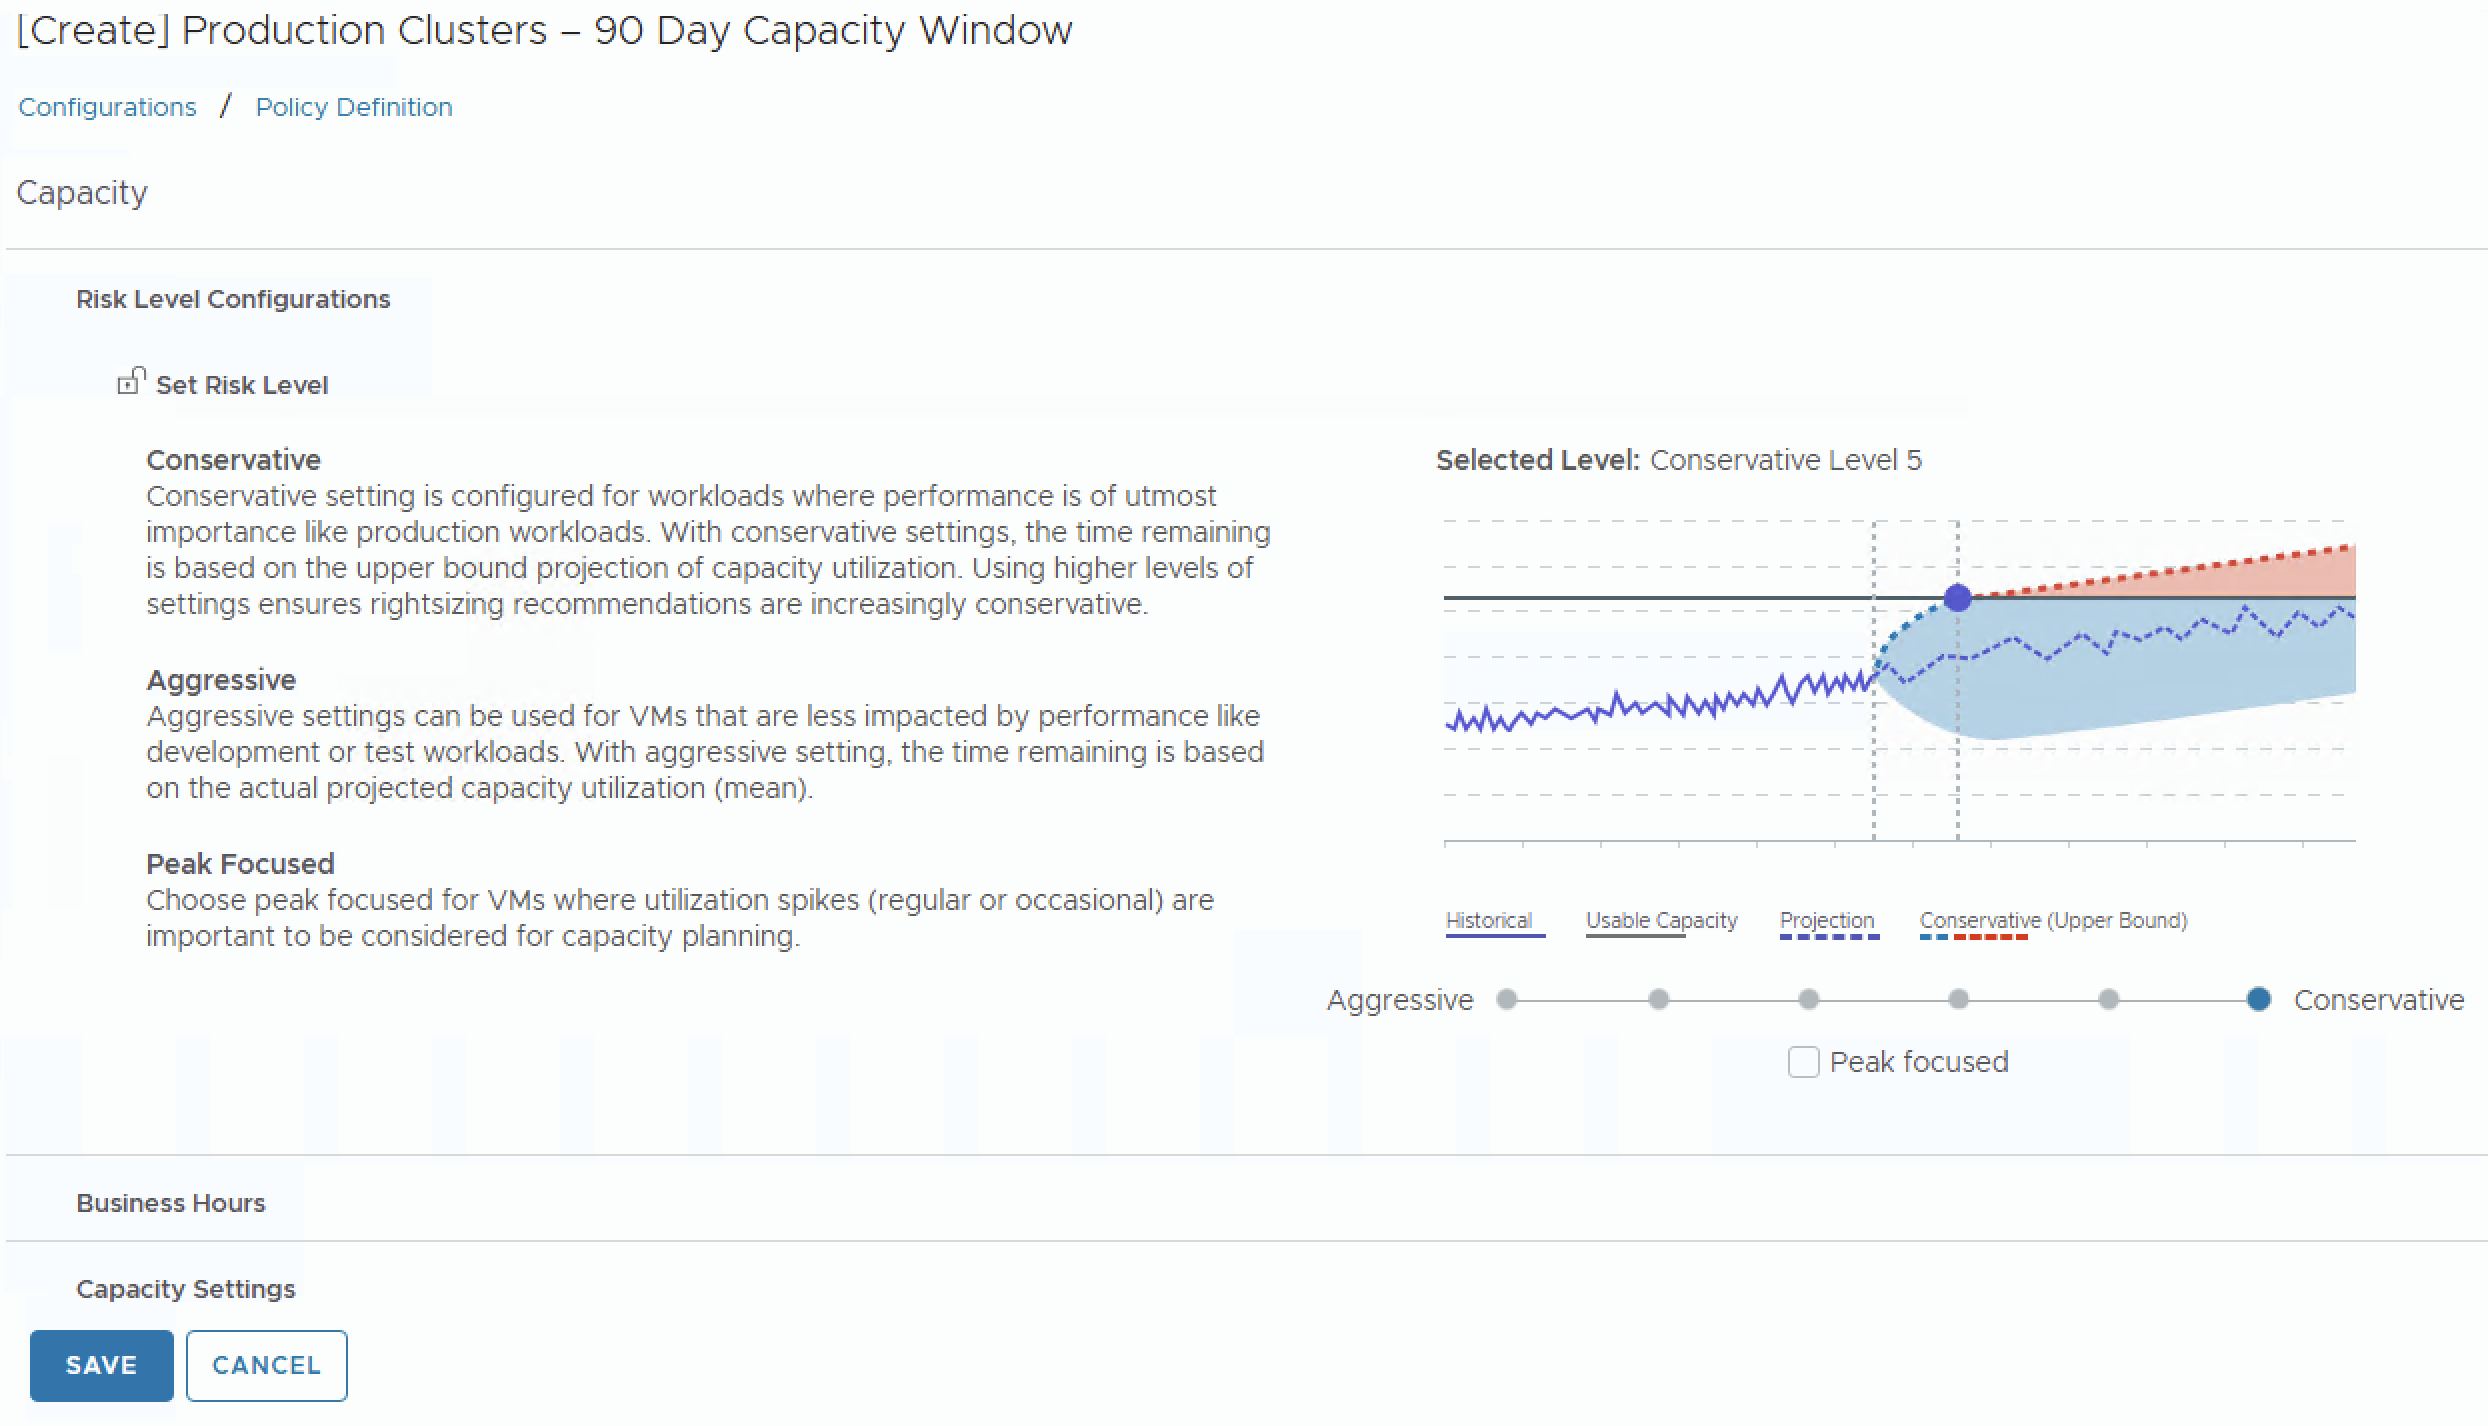
For a 90-day capacity planning model, set this to Conservative. This ensures that the periodic spikes captured within that 90-day window are not averaged away.
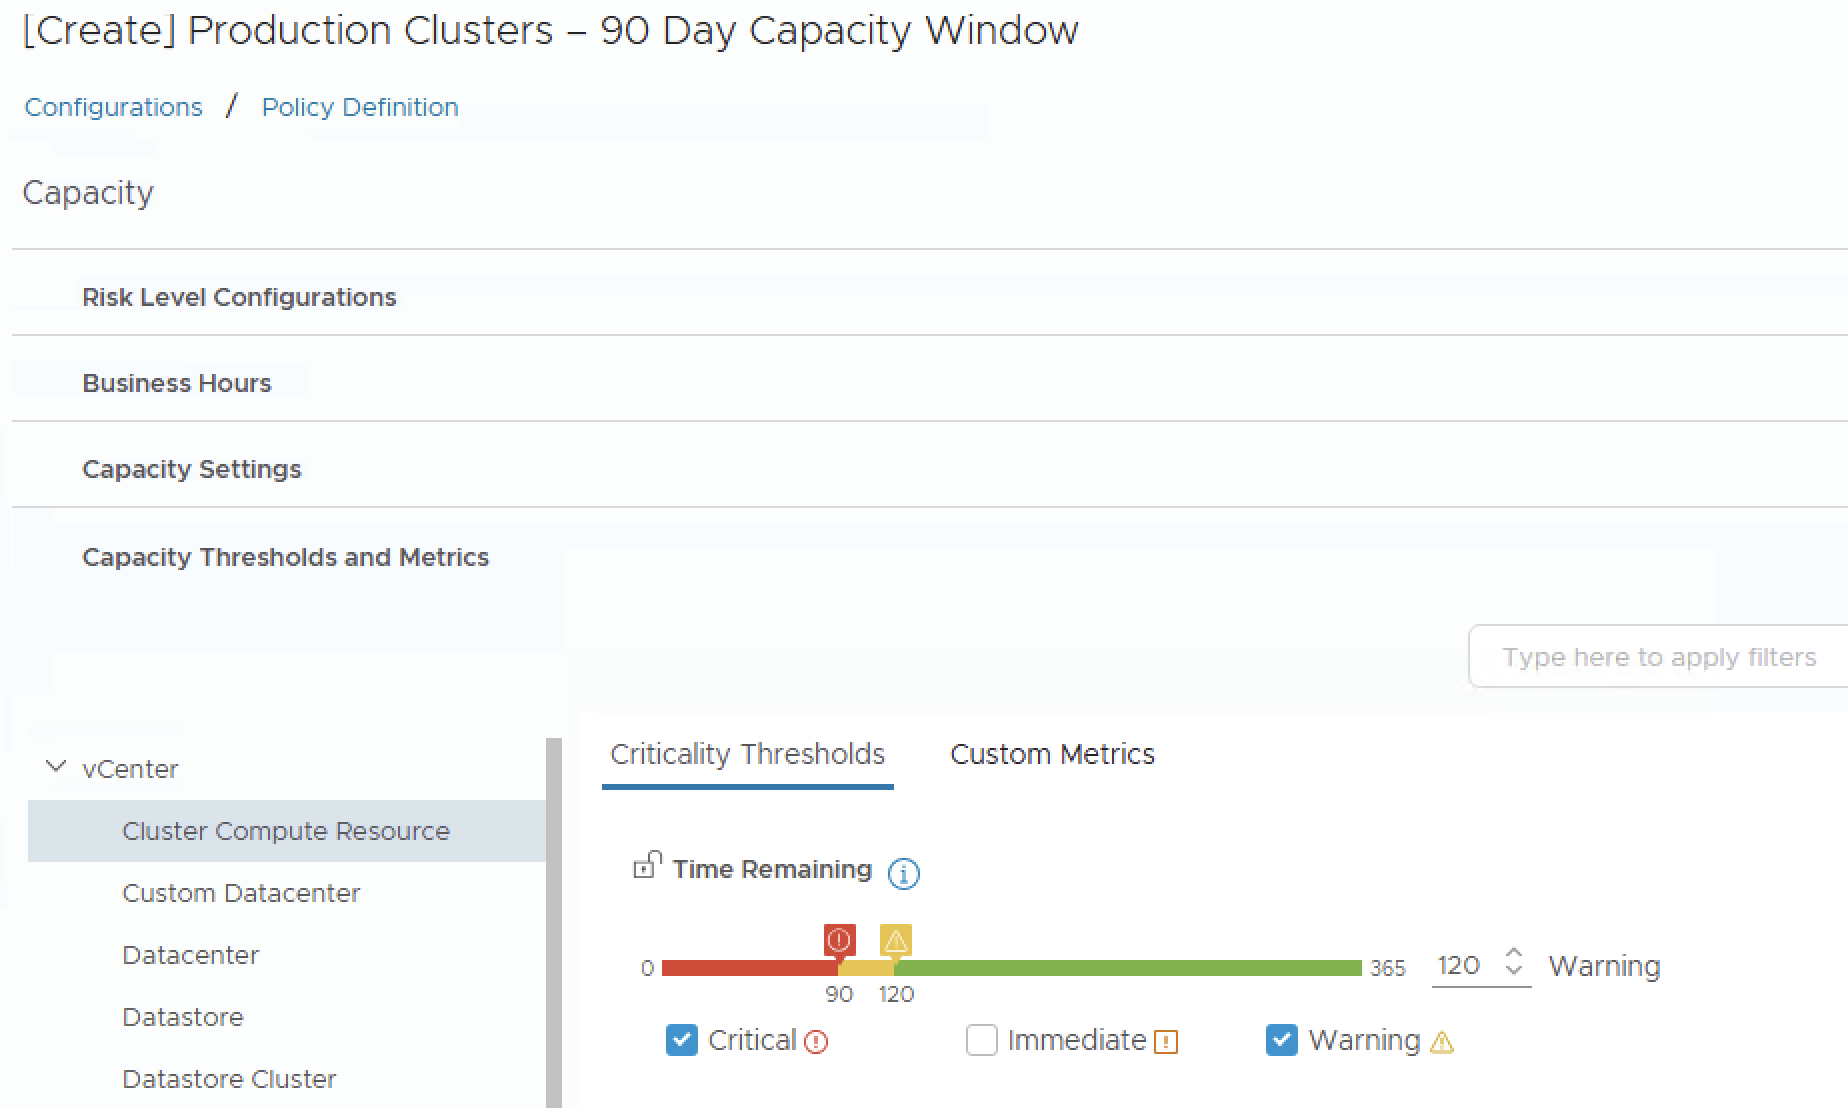
Time Remaining Thresholds
These thresholds define when VCF Operations triggers capacity alerts. Align them with your 90-day planning cycle:
| Threshold | Recommended Value | Rationale |
|---|---|---|
| Warning | 120 days | Gives you a full quarter plus a 30-day buffer to initiate procurement |
| Critical | 90 days | Aligns exactly with your quarterly planning boundary |
Setting the Critical threshold to 90 days means that when the capacity engine projects resource exhaustion within the next 90 days, you will receive a critical alert — directly aligning the tool with your procurement lead time.
Capacity Buffers
Capacity buffers reserve a percentage of total usable capacity as headroom. These are subtracted from the total before usage percentages are calculated:
| Resource | Recommended Buffer | Notes |
|---|---|---|
| CPU | 10–15% | Accounts for HA failover and burst headroom |
| Memory | 10–15% | Memory is typically the first resource to constrain |
| Disk | 15–20% | vSAN environments need additional headroom for rebalancing operations |
These buffers ensure that when the engine says you have 90 days of capacity remaining, it actually means 90 days with comfortable headroom — not 90 days until the cluster is at 100% and VMs start ballooning.
Peak Focused Setting
If your environment has significant periodic peaks (month-end processing, backup windows, etc.), enable the Peak Focused setting. This tells the capacity engine to give higher weight to utilization spikes when projecting future needs. Combined with the Conservative risk level and a 90-day critical threshold, this creates a capacity model that respects your historical peak demand patterns.
Step 3 — Use Maintenance Schedules to Protect Your 90-Day Baseline
When a non-recurring event is happening in your environment — a one-time data migration, a stress test, a host rebuild — the resulting utilization data will feed into the capacity engine and skew your 90-day projections. VCF Operations provides Maintenance Schedules to prevent this.
A Maintenance Schedule pauses data collection and suppresses alerts for selected objects during a defined window. Because the capacity engine cannot project on data it never collected, those anomalous periods are effectively excluded from your 90-day baseline.
- Navigate to Infrastructure Operations > Configuration > Inventory Management.
- Select the object(s) that will be affected by the non-standard activity (e.g., the ESXi hosts involved in a migration).
- Click Start Maintenance.
- Define the start and end times of the maintenance window, or set it to run indefinitely if you are unsure when the activity will complete and plan to stop it manually.
Tip: If you know the maintenance window in advance, schedule it before the activity begins. The engine will not collect any metrics during that window, keeping your historical data clean for capacity planning.
Once the maintenance window ends, data collection resumes automatically and the capacity engine continues its projections based only on valid operational data.
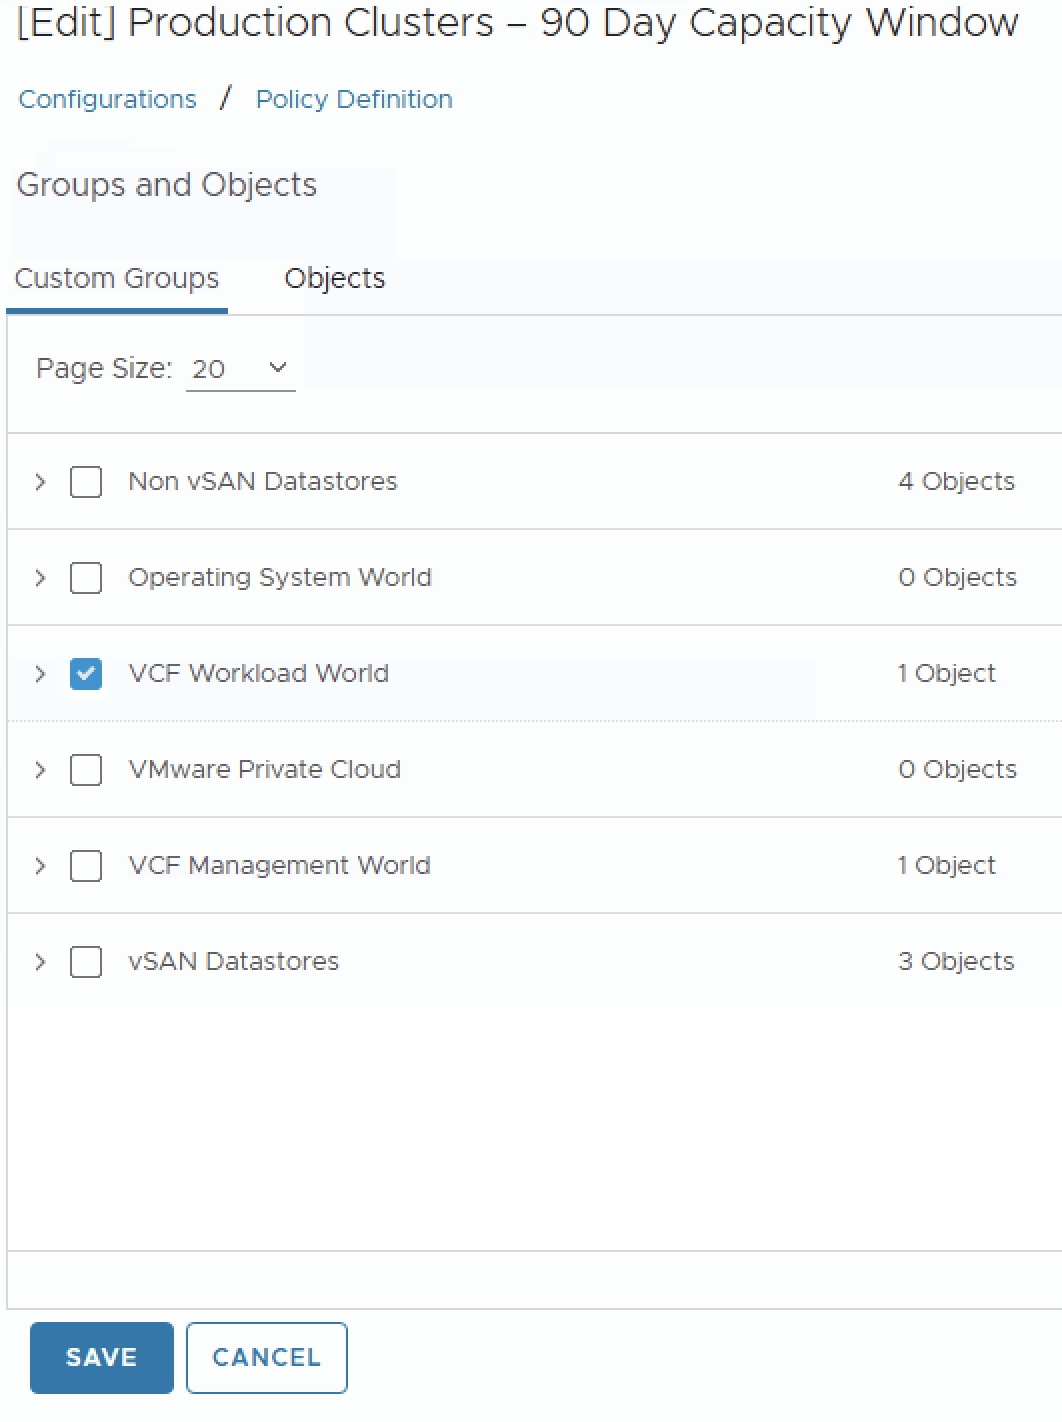
Step 4 — Apply the Policy to Your Clusters
The policy only takes effect when it is attached to the correct objects:
- Still in the Policy workspace, navigate to the Groups and Objects section.
- Apply the policy to a Custom Group or directly to your production vSphere clusters.
- If you have not created a Custom Group yet, go to Infrastructure Operations > Configuration > Custom Groups and create one that includes your production clusters.
Important: Policy precedence matters. If multiple policies apply to the same object, the most specific one wins. Verify your policy is the active one for the target clusters by checking Policies > Active Policies.
Step 5 — Validate the Configuration
After applying the policy, wait for at least one full collection cycle (typically 5 minutes) and then validate:
- Navigate to Capacity > Optimize > Assess.
- Select one of your production clusters.
- Review the Time Remaining and Capacity Remaining metrics. They should now reflect the configured thresholds (warning at 120 days, critical at 90 days).
- Check the Demand Trend chart — the projection curve should show a conservative (upper bound) trend line that accounts for historical peaks.
If the values look unreasonably aggressive or conservative, revisit your buffer percentages and risk level settings.
Bringing It All Together
Here is a summary of the full configuration for a 90-day capacity planning model:
| Setting | Value |
|---|---|
| Risk Level | Conservative |
| Warning Threshold | 120 days |
| Critical Threshold | 90 days |
| CPU Buffer | 10–15% |
| Memory Buffer | 10–15% |
| Disk Buffer | 15–20% |
| Peak Focused | Enabled |
| Maintenance Schedules | Used during non-standard events |
| Policy Applied To | Production Clusters (Custom Group) |
Why This Matters Beyond Dashboards
Getting the capacity engine right is not about making the dashboards look green. It is about answering the question your CTO is going to ask: “Will we run out of capacity before our next hardware refresh?”
With a 90-day model you can:
- Justify hardware purchases with data rooted in 90 days of real demand, not just last week’s averages.
- Catch cyclical patterns that shorter windows miss — month-end, quarter-end, year-end processing.
- Reduce overprovisioning by using conservative projections that account for peaks without panic-buying.
- Align IT and finance by speaking the same quarterly language.